Statistics Graph Card
The Statistics Graph card allows you to display a graph of statistics data for each of the entities listed.
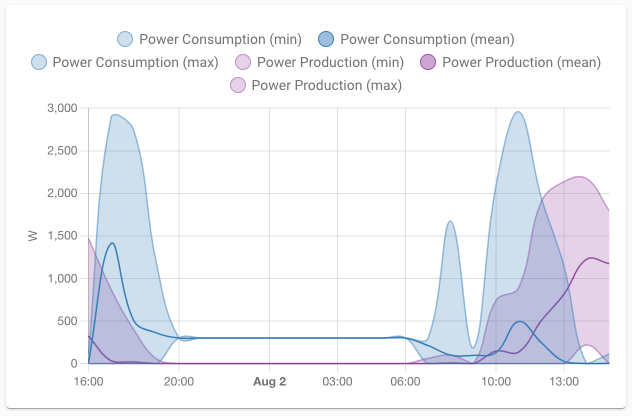 Screenshot of the Statistics Graph card with none metered entities and `chart_type` `line`.
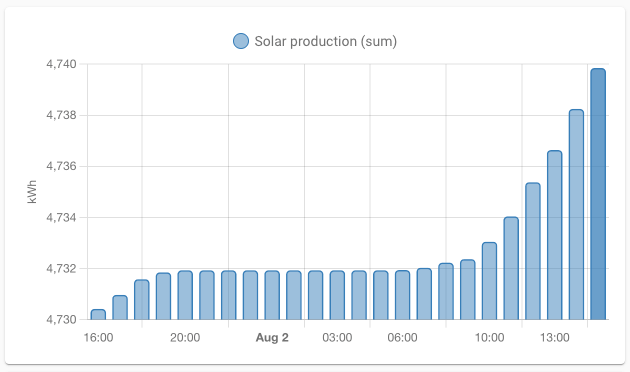 Screenshot of the Statistics Graph card with a metered entity and `chart_type` `bar`.
Statistics are gathered every 5 minutes for sensors that support it. It will either keep the min, max, and mean of a sensor’s value for a specific hour or the sum for a metered entity.
If your sensor doesn’t work with statistics, check this.
To add the Statistics Graph card to your user interface, click the menu (three dots at the top right of the screen) and then Edit Dashboard. Click the Add Card button in the bottom right corner and select from the card picker.
All options for this card can be configured via the user interface.
YAML Configuration
The following YAML options are available when you use YAML mode or just prefer to use YAML in the Code Editor in the UI.
Configuration Variables
A list of entity IDs or entity objects (see below), or an external statistic id
Options For Entities
If you define entities as objects instead of strings, you can add more customization and configuration:
Example
type: statistics-graph
title: 'My Graph'
entities:
  - sensor.outside_temperature
  - entity: sensor.inside_temperature
    name: Inside